 (pg. 35)
In this lesson, we discussed how to solve 2-step word problems, and represent the problem solving steps with bar diagrams. The purpose of the bar diagrams is to provide a visual bridge between the in-words description in the word problem, and the number sentence computation that gives the answer.
In a two-step word problem, the process involves deciding what should be computed first, and what second, and then determining and computing both steps.
Most of the examples in this lesson are taken from the textbook Primary Mathematics 3A. I'll include the page numbers and a few screen captures so you can look at the carefully polished examples included in the book.
Addition and subtraction
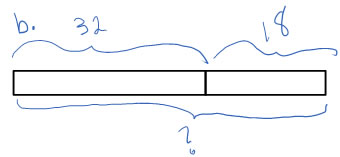
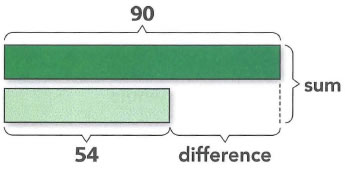
First a reminder: when showing a sum, you need bars to show the amounts or parts being added, and grouping symbol (or another bar) that indicates the sum. When showing a difference, you need bars that represent the compared amounts, and a grouping symbol to show the difference.
Another representation for subtraction (when you have a PPW-Part Unknown problem), is to show the parts side by side, with a grouping symbol (or another bar) showing the whole. In this case one of the bars is labelled with a "?" to show that it represents an unknown amount. It's important to know that both of these diagrams indicate a subtraction situation.
Mary made 686 paper flowers. She sold some of them.
If 298 were left over, how many flowers did she sell?
(pg 45)
2-step examples with addition and subtraction
An in-between step for learning to solve 2-step problems, is to solve 2-step problems where the parts (a and b) of the problem explicitly ask for the necessary steps in order:
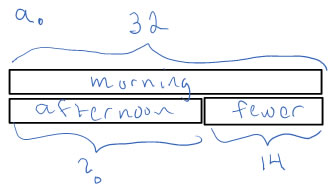
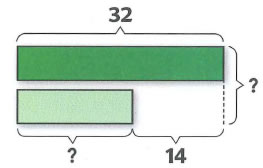
John read 32 pages in the morning.
He read 14 fewer pages in the afternoon.
(a) How many pages did he read in the afternoon?
(b) How many pages did he read altogether?
Here, part (a) prompts for the first step you would need to compute, and part (b) uses the result from a to get a solution.
32 - 14 = 18 He read 18 pages in the afternoon |
32 + 18 = 40 He read 40 pages altogether. |
Usually, you need two separate diagrams to show the two solution steps. Sometimes, however, they can be combined. Here's how the authors of Primary Mathematics 3A combined the steps in this problem into one diagram:
In a full 2-step word problem, the student must figure out the steps. So to solve the problem:
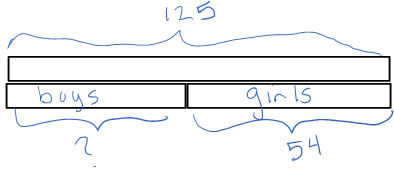
125 children took part in a mathematics competition.
54 of them were girls.
How many more boys than girls were there?
you need to figure out that first you need to know how many were boys, and then you can figure out how many more boys than girls there were.
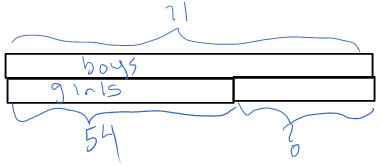
125 - 54 = 71 71 of them were boys. |
71 - 54 = 17 There were 17 more boys than girls |
Multiplication and Division:
In the previous section, you'll find examples of bar diagrams for 1-step word problems. There are additional good examples of multiplication and division bar diagrams on pages 78 and 79 of Primary Mathematics 3A.
Most 2-step word problems that involve multiplication and division have a multiplication or division step and an addition or subtraction step.
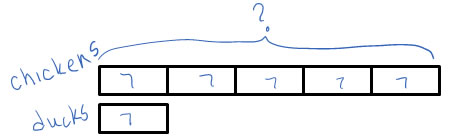
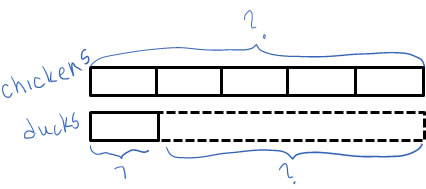
In this example, the multiplication step comes first, and the subtraction step comes second--first you have to find the number of chickens, and then you can find how many more chickens than ducks:
A farmer has 7 ducks.
He has 5 times as many chickens as ducks.
How many more chickens than ducks does he have?
You can represent this using two separate diagrams--one for each step:
5 x 7 = 35 He has 35 chickens |
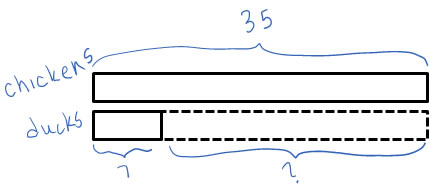
35 - 7 = 28 He has 28 more chickens than ducks |
Some notes about the bar diagrams: It's OK to write 7 into each part, as in the diagram on the left, and it's OK to write it just once so long as the bars look approximately equal. It's OK to write the numbers in the bar, and it's OK to write the numbers above the bar. It's OK to use a bar to show the difference, and it's OK to leave that space blank (that's what I'm trying to show by the dotted lines on the bar in the diagram on the right).
This problem is also one where you could get away with having only one diagram, if you put it together very cleverly:
Ducks and chickens:
Teaching note: You can also find this example on page 79 in Primary Mathematics 3A. In that example, they only show a bar diagram for the first part. I want you to know how to make bar diagrams to help you explain both parts, but as a teacher, you'll be deciding how much support your students need for understanding each part (so with some problems or some classes you may choose to use a diagram for each part of a word problem, and with other problems or classes, you may choose to use diagrams with only one parts, or you may decide that the students are ready to make the transition from the in-words description to the number sentence without the aid of a diagram).
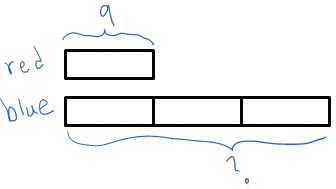
An example with multiplication and addition:
There are 9 red balloons.
There are 3 times as many blue balloons as red balloons.
How many balloons are there altogether?
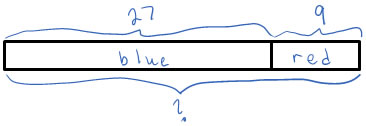
The first step is to find how many blue balloons there are, then you can find out how many altogether.
3 x 9 = 27 There are 27 blue balloons. |
27 + 9 = 36 There are 36 balloons altogether. |
I'm realizing that this is a step I often forget (and, indeed, forgot to include in our on-line discussion), but it's good to model for students the step of writing down your answer in a sentence (There are 36 balloons altogether) or at least with units (36 balloons).
An example with multiplication and division:
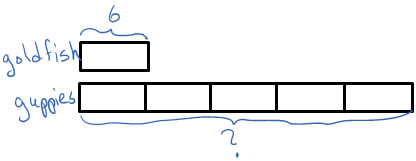
Brian has 6 goldfish.
He has 5 times as many guppies as goldfish.
If he puts his guppies equally into 3 tanks, how many guppies are there in each tank?
The first step is to find how many guppies there are, then you can find how many guppies would go in each of the 3 tanks.
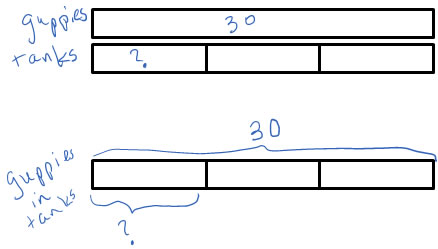
5 x 6 = 30 He has 30 guppies |
30 ÷ 3 = 10 There are 10 guppies in each tank. |
I have provided two examples of how to draw out the division bar diagram. The one on the bottom is more similar to how you would see the bar diagram in the Primary Mathematics books (the simplest form), but the one on the top works quite well too.
When I grade your bar diagram representations, I am looking for a representation that is clear and matches the sense of the in-words problem.